 Hydrohistorian
Graphical presentation of the daily mean discharge, South Boulder Creek — State Engineer's biennial report, 1893-1894 (Part II)
Internet Archive · 1893-1894 · Colorado Office of the State Engineer
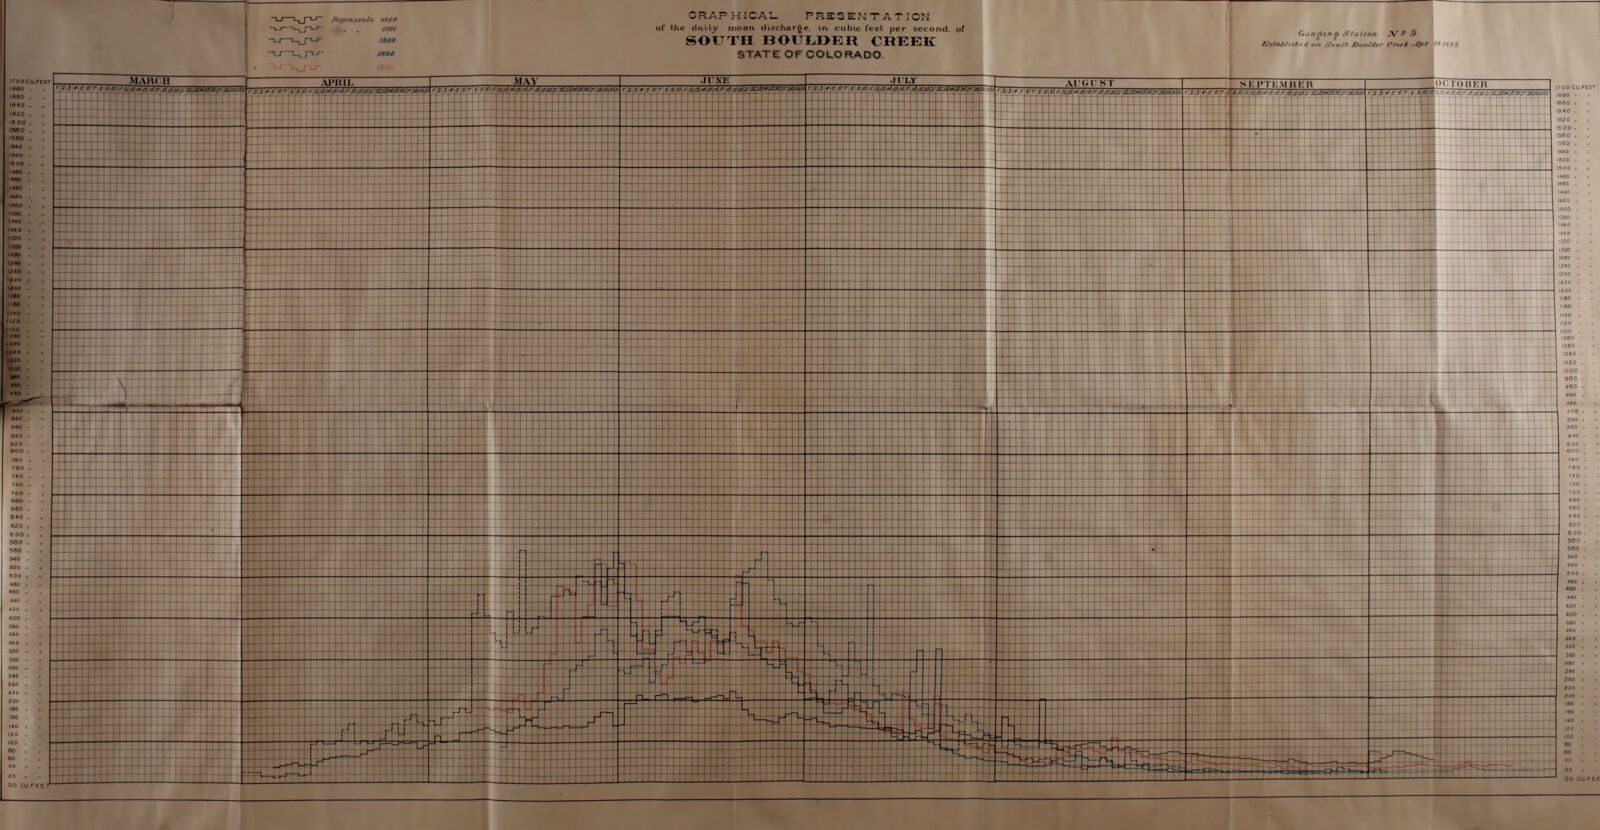
Biennial report of the State Engineer to the Governor of Colorado for the years 1893 and 1894, Part II. Colorado Office of the State Engineer; digitised by Colorado State Publications Library, Internet Archive biennialreportofcolo_4. Public domain. Archive record ↗ · Rights
Source Archival record · verify at Internet Archive ↗ Source Probable join · The plate's title block OCRs to “SOUTH BOULDER CREEK” (best fuzzy match 1.00, and clear of every other gauged stream); that stream is this water district.
A hydrograph before hydrographs were routine: the State Engineer's office plotted South Boulder Creek's daily mean discharge by hand and bound it into the 1893-1894 report.
Shows: That the office was gauging South Boulder Creek and publishing the daily record, and the shape of that season's runoff as it drew it.
What this does not let you conclude: What the gauge was, where it stood, or how it was rated -- the plate is a drawing, not a record we can recompute, and its numbers are not comparable with today's telemetry without the report's own text. The years the report covers; the plate's own seasons may be a subset.
Placed on
- District d1_wd6_boulder_creek · gallery · our placement, by name and place
- Division 1 · gallery · our placement, by name and place